Gowanus BID · Urban Design Strategies and Case Studies
GO-Wanus Green: Beyond Static Planning
A community-supported, agent-based urban forestry roadmap for the Gowanus BID.
Team 3: Liu, Wang, Zhang, Yin, Yao
00 · Introduction
What Can a Green Future Bring?
The gap
Ecological Pressure
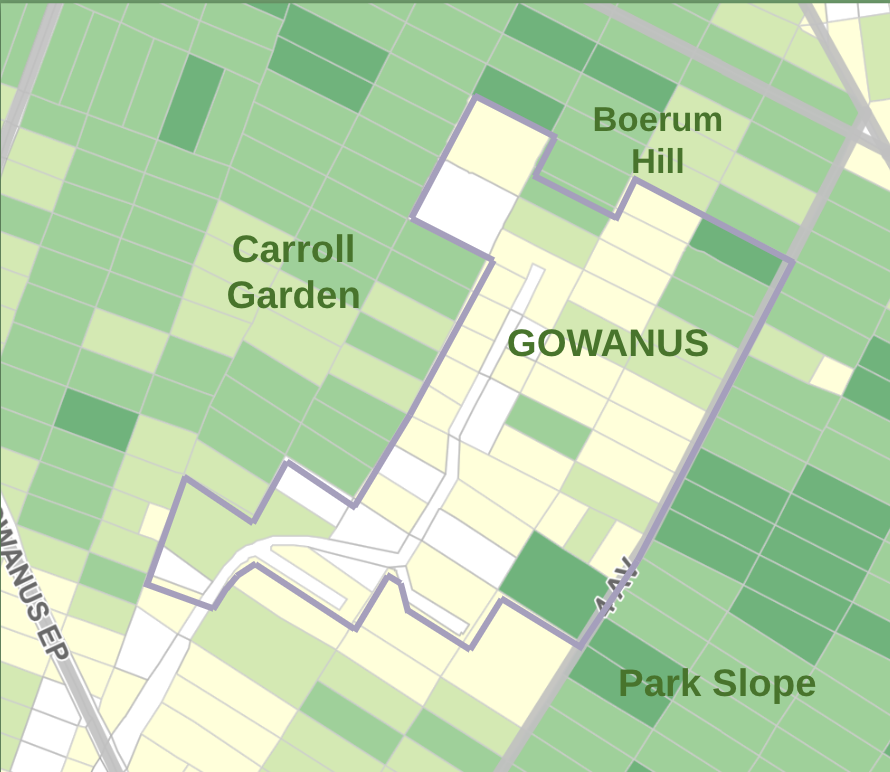
Street trees in Gowanus are characterized as young, sparse, and low in diversity. Narrow sidewalk design not only limits tree growth, but also damages nearly 50% of tree-adjacent sidewalks.
35%
Trees under 6" DBH
36%
Native species only
~50%
Sidewalks under 10 ft
15%
Moderate flood risk zone
The Future
Resilient & Livable Streetscape
The intervention targets streets under the most ecological pressure by adding ~176 trees in areas with low canopy and highest stormwater flood risk, and widening high-conflict corridors to support tree growth.
The redesigned streetscape creates a safer, more comfortable pedestrian experience, encouraging longer dwell time and stronger local retail activity.
Narrowed roadways reduce vehicle accessibility within the community, lowering gas emissions and improving pedestrian friendliness.
48–172%
Retail range (lit. streetscape)
+83.1%
Pedestrian dwell (vs. S0)
+13.8%
Ecological benefit signal
−10.7%
Vehicle trips — explicit trade-off
Research spine
Motivation & context
Insights
As a former industrial community transitioning to residential mixed-use, creating a pedestrian and ecologically friendly environment is essential to attract new residents. However, Gowanus's industrial legacy, fragile ecological system, and budget limitations all make its green transformation challenging.
Click each card to view the problem breakdown.
Spatial transformation
Transformation
To transform current conditions into the proposed green corridors, we developed a 2-step tree planting strategy that prioritizes ecologically vulnerable streets.
02 · Intervention strategy
Intervention scenarios
Click a scenario to view the corresponding spatial intervention. Planned tree locations are predefined to maximize ecological benefits.
Legend
Sidewalks Change (ft)
S2 Full: all S1 trees plus wider sidewalk corridors (violet) and additional canopy coverage.
02b · Planting design
Species and Planting Strategies
Planting strategy
Prioritize flood-prone, low-canopy streets to improve shade, stormwater capture, and comfort.
Match species to sidewalk width, soil volume, and street exposure for healthier growth.
Use expanded tree beds and permeable paving to support roots and reduce runoff.
Avoid overrepresented species such as London Plane, Honey Locust, and Ginkgo to improve biodiversity.
Simulation methodology
Prediction
We use GAMA to run spatially-explicit agents on Gowanus streets. Commuters, random locals, scenic visitors, joggers, and drivers each carry distinct routing and dwell heuristics, feeding crowding, shade, and Linger-based retail exposure for scenario comparison.
Expand for detail
GAMA is an easy-to-use open source modeling and simulation environment for creating spatially explicit agent-based simulations. It allows us simulate how people and vehicles move through streets and public space. We use it here because the project must compare interventions under behaviorial and spatial constraints, where GAMA can provide scenario testing outputs with transparent, repeatable logic.
Agent behavior
Behavioral Overflow
Where indirect behavioral effects accumulate — pedestrian rerouting toward shade and vehicle congestion from narrowed corridors.
Pedestrians' Logic Flow
Gowanus Trees: Simulation Overview and Process Chain
Vehicles' Logic Flow
Gowanus Vehicles simulation overview
Scenarios & impact
Outcome & Prediction
Prediction outputs are grouped into numbers first, charts second, and spatial impact last. This keeps the section readable and professional.
Interactive chart
S0 vs S2 — pollutant trajectories (line race)
Apache ECharts animation: O₃, NO₂, SO₂, and PM over the modeled horizon. Served from your exported line-race.html in public/.
Pedestrian Vitality (S2 vs S0)
Pass-through flow
Adding trees and space increases overall pedestrian movement drastically compared to baseline.
+41.5%
Average dwell time
Time spent lingering rises from ~74s to ~135s.
+83.1%
Vehicle Trade-offs (S2 vs S0)
Completed trips
Completion rate drops from 90.8% to 81.1% due to narrowed road bottlenecks.
-10.7%
Emissions
Reduced vehicle miles traveled naturally reduces localized gas and PM emissions.
-14.9%
Up to 21.4% increase in 20-year eco-benefit under S2 vs. baseline—driven by combined hardscape and planting interventions.
Figures are indicative of coupled green–infrastructure benefits; calibrate to your i-Tree runs and BID geodata.
NYC DOT complete-street and corridor redesigns have been associated with roughly 48–172% potential retail sales lift in published streetscape studies—context and lease mix apply.
Use with local sales tax / POS panels where available to localize the range for the BID.
Stakeholders & delivery
Consensus & Action
A 9-month approval pipeline aligning GCC, BID, and DOT authority with on-the-ground stewardship.
Simulation as a Negotiation Platform
Our GAMA model is not just a tool; it is a common language. By identifying gap sites, we achieve canopy goals while respecting local parking needs and avoiding rigid DOT/Parks friction points.
Estimated Budget
GCC Technical Review
↗ open9-Month Approval Pipeline
Click any timeline card
Sources & citation
Reference
Websites, tools, and local datasets used across this portfolio.
Organizations
Stakeholder reference used in the approval timeline.
BID participation and engagement reference.
Pilot permitting and streetscape policy context.
Urban forestry coordination and tree stewardship context.
Stormwater and environmental infrastructure context.
Platforms & Tools
Basemap tiles and OSM embed are used in map modules.
Line-race chart runtime for pollutant trajectories.
Data processing and spatial analysis tool for preparing GIS layers.
Agent-based simulation framework referenced in methodology.
Datasets
Local dataset from public/data_from_gama.
Local dataset from public/data_from_gama.
Local dataset for current tree distribution.
Scenario datasets paired with bid_trees_new.geojson and street_change.geojson.
Academic Papers
Nowak, D. J., Crane, D. E., & Stevens, J. C. (2006). Air pollution removal by urban trees and shrubs in the United States. Urban Forestry & Urban Greening, 4(3-4), 115-123.
DOIShetty, N. H. (2023). Estimating stormwater infiltration and canopy interception for street tree pits in Manhattan, New York. Forests, 14(2), 216.
DOIWestfall, J. A., Nowak, D. J., Henning, J. G., Lister, T. W., Edgar, C. B., Majewsky, M. A., & Sonti, N. F. (2020). Crown width models for woody plant species growing in urban areas of the U.S. Urban Ecosystems, 23(4), 905-917.
DOIMailloux, B. J., McGillis, C., Maenza-Gmelch, T., Culligan, P. J., He, M. Z., Kaspi, G., Miley, M., Komita-Moussa, E., Sanchez, T. R., Steiger, E., Zhao, H., & Cook, E. M. (2024). Large-scale determinants of street tree growth rates across an urban environment. PLoS ONE, 19(7), e0304447.
DOIRosenzweig, C., Solecki, W., & Slosberg, R. (2006). Mitigating New York City's heat island with urban forestry, living roofs, and light surfaces (Final Report 06-06). New York State Energy Research and Development Authority.
Report PDFNowak, D. J. (1996). Estimating leaf area and leaf biomass of open-grown deciduous urban trees. Forest Science, 42(4), 504-507.
DOI